You don’t need to survey everyone to get reliable results. Sample size is the number of completed survey responses needed to represent a larger population within a chosen margin of error and confidence level. A properly sized sample can reflect thousands - or even millions - of people with known accuracy.
This guide explains how sample size works, why it matters, and how to avoid common mistakes. Use the Sample Size Calculator to calculate your required sample size.
Most business surveys don’t fail because of bad questions. They fail because of bad sampling.
Why Sample Size Matters
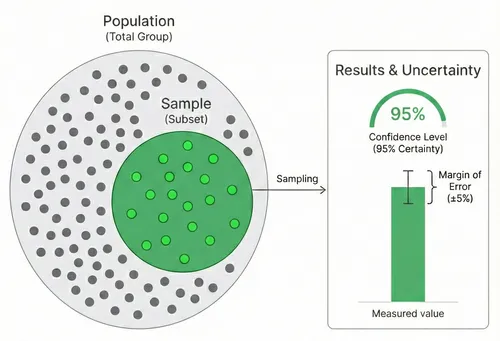
Sample size affects two key factors:
- Margin of error: How close your sample results are to the true population value
- Confidence level: How certain you can be that your results fall within the margin of error
Get the sample size wrong, and you’ll either waste resources surveying too many people or get unreliable results from too few.
Quick Reference: How Many Responses Do You Need?
All values assume 95% confidence level and maximum variability (p = 0.5). Use the Sample Size Calculator for custom values.
| Your Population | ±3% Margin | ±5% Margin | ±10% Margin |
|---|---|---|---|
| 50 | 48 | 45 | 34 |
| 100 | 92 | 80 | 50 |
| 200 | 169 | 132 | 66 |
| 500 | 341 | 218 | 81 |
| 1,000 | 517 | 278 | 88 |
| 5,000 | 880 | 357 | 95 |
| 10,000 | 965 | 370 | 96 |
| 50,000+ | 1,045 | 382 | 96 |
For populations above 50,000, sample size barely changes - you’re already past the point of diminishing returns.
Key Concepts
Population Size
The total number of people who could take your survey. This might be:
- All your customers (e.g., 50,000)
- Employees in your company (e.g., 500)
- Users of a specific feature (e.g., 10,000)
- Visitors to your website last month (e.g., 100,000)
For very large populations (100,000+), sample size barely changes because you’re already capturing statistical significance.
Confidence Level
How certain you want to be that your sample results reflect the true population.
| Confidence Level | Interpretation |
|---|---|
| 90% | You’re 90% sure the true value falls within your margin of error |
| 95% | Industry standard - 95% certainty |
| 99% | Very high certainty, requires larger sample |
Use 95% unless you have a specific reason to change it. It’s the standard for business decisions.
Margin of Error
The acceptable range of error in your results. If your survey shows 60% satisfaction with a ±5% margin of error, the true value is between 55% and 65%.
| Margin of Error | Use Case |
|---|---|
| ±3% | High-stakes decisions requiring precision |
| ±5% | Standard for most business surveys |
| ±10% | Exploratory research or resource-constrained surveys |
Smaller margins require larger samples. A ±3% margin needs roughly 2.5× more responses than ±5%.
The Sample Size Formula
This guide uses Cochran’s formula adjusted for finite populations.
Step 1: Calculate Initial Sample Size (Infinite Population)
n₀ = (Z² × p × (1-p)) / e²Where:
- Z = Z-score for your confidence level (1.96 for 95%)
- p = Expected proportion (0.5 for maximum variability)
- e = Margin of error as decimal (0.05 for 5%)
Step 2: Adjust for Finite Population
n = n₀ / (1 + (n₀ - 1) / N)Where:
- N = Your population size
- n₀ = Initial sample size from step 1
You don’t need to solve this manually-this is what the calculator does.
Why We Use p = 0.5
The proportion (p) represents expected response distribution. If you’re asking a yes/no question, p = 0.5 means you expect a 50/50 split.
We use 0.5 because:
- It produces the largest (most conservative) sample size
- You don’t need to guess what results you’ll get
- It’s the safest assumption when you don’t have prior data
If you know your proportion is extreme (e.g., 90% yes), you can use a smaller sample-but only when you have strong prior data.
Response Rates & Invitations
Your required sample size is not the number of people to invite. You need to account for response rates.
Typical Survey Response Rates
| Survey Type | Response Rate |
|---|---|
| In-app/embedded | 20-40% |
| Email (customers) | 10-30% |
| Email (employees) | 30-50% |
| Post-transaction | 15-25% |
| NPS relationship surveys | 10-20% |
Formula: People to invite = Sample size ÷ Expected response rate
If you need 400 responses and expect 20% response rate:
- 400 ÷ 0.20 = 2,000 people to invite
Common Mistakes
Ignoring response rates
Calculating you need 400 responses but only inviting 400 people guarantees insufficient data.
Using population size for sample size
“We have 10,000 customers, so we need 10,000 responses.” You don’t. Around 370 responses give you ±5% accuracy.
Forgetting about subgroups
If you plan to analyze by segment (region, product, customer type), each subgroup needs adequate sample size. You might need 400 responses per segment, not 400 total.
Not considering non-response bias
If only happy customers respond, your results won’t represent everyone. Aim for response rates above 20% to minimize bias.
Over-precision
A ±3% margin sounds better than ±5%, but it requires 2.5× more responses. For most business decisions, ±5% is sufficient.
When Sample Size Rules Don’t Apply
Standard sample size calculations assume:
- Random sampling: Everyone has equal chance of being selected
- Representative responses: Respondents are similar to non-respondents
- Single population: You’re measuring one group, not comparing groups
These assumptions break down when:
- You’re surveying self-selected volunteers
- Response rates are very low (under 10%)
- You’re running a longitudinal study
- You have highly niche populations
In these cases, statistical accuracy depends more on sampling method than sample size.
Best Practices
Define your population clearly
Who exactly are you surveying? “Our customers” is vague. “Active customers who made a purchase in the last 12 months” is specific.
Use stratified sampling for diverse populations
If your population has distinct segments, sample proportionally from each to ensure representation.
Plan for analysis upfront
If you’ll break down results by region, ensure each region has enough responses. Three respondents from Asia isn’t statistically meaningful.
Document your methodology
Note your population size, sampling method, response rate, and margin of error. This adds credibility to your findings.
Consider the decision at stake
A ±10% margin might be fine for exploratory research. For decisions affecting millions of dollars, invest in ±3% precision.
Sample Size Examples by Use Case
Employee Engagement Survey
Scenario: Company with 500 employees
Required responses: 217 (±5%, 95% confidence)
Expected response rate: 40%
Action: Invite all 500 employees, expect 200-250 responses
Customer Satisfaction Survey
Scenario: 10,000 active customers
Required responses: 370 (±5%, 95% confidence)
Expected response rate: 15%
Action: Invite 2,500 customers via email. Use the CSAT Calculator to measure satisfaction from collected responses.
Product Feedback Survey
Scenario: 100,000+ users
Required responses: 384 (±5%, 95% confidence)
Expected response rate: 10%
Action: Show in-app survey to 4,000 users
Small Business Survey
Scenario: 50 customers
Required responses: 44 (±5%, 95% confidence)
Expected response rate: 30%
Action: Invite all 50 customers - at 30% you’ll get ~15 responses, which is below target. Send a follow-up reminder (typically doubles response rate) or accept ±10% margin (only 33 needed).
Next Steps
Use the Sample Size Calculator to determine your target, then check out our survey templates to get started.
Frequently Asked Questions
Estimate conservatively. If you think you have 5,000-10,000 customers, use 5,000. For very large populations (50,000+), the exact number barely matters - the required sample size plateaus around 380 responses for ±5% accuracy.
Not necessarily. Beyond your minimum sample size, additional responses have diminishing returns. Going from 400 to 4,000 responses changes margin of error from ±5% to ±1.5% - rarely worth the effort for most business decisions.
Sample size calculations apply to quantitative data (numbers, percentages). For open-ended questions, you'll often reach "saturation" (no new themes emerging) with 20-30 thoughtful responses.
Keep surveys short (5 minutes max), send at optimal times (Tuesday-Thursday, 10am-2pm), use personalization in invitations, explain why feedback matters, and offer incentives if appropriate. Follow-up reminders typically double your initial response rate.
It depends on your population size. For populations over 10,000, 100 responses gives you roughly ±10% margin of error at 95% confidence. That's acceptable for exploratory research but not for important business decisions. For ±5% accuracy, you need at least 370 responses.
The "rule of 30" applies to statistical tests like t-tests, not to survey sampling. For surveys, 30 responses rarely provides meaningful accuracy. Even with a small population of 100, you need about 80 responses for ±5% margin of error. Use the sample size calculator to find the right number for your situation.
It varies by channel. Employee surveys typically get 30-50%, customer email surveys 10-30%, and in-app surveys 20-40%. Anything above 20% is generally considered adequate for minimizing non-response bias. Below 10%, your results may not represent the full population regardless of sample size.
For 95% confidence with ±5% margin of error: about 370 responses for large populations (10,000+), 278 for 1,000 people, or 217 for 500 people. The smaller your population, the larger the proportion you need to survey. Use the sample size calculator for exact numbers.
With 50 responses from a large population, your margin of error is roughly ±14% at 95% confidence. That's imprecise but still useful for directional insights - identifying major trends or severe problems. Consider accepting a wider margin, or try follow-up reminders, shorter surveys, and in-app distribution to increase your response count.
Calculate the margin of error for your actual response count. If your survey got 50 responses from 5,000 people, your margin of error is about ±14% - meaning a result of 60% could actually be anywhere from 46% to 74%. If that range is too wide to make a confident decision, your sample is too small. Use the sample size calculator to check.
No. Sample size depends on population size, margin of error, and confidence level - not on the number of questions. However, longer surveys reduce response rates, which means you may need to invite more people.